Heat Loss to the Ground (Part 1)
Ground heat loss does not equal ambient air heat loss. Sounds pretty straight forward, right? Well, it's a lot more complex than that. I teach an online course about Zero Net Energy Homes. In that course, the participants learn to do design heat loss calculations and annual energy use modeling, among other things. One topic that always draws questions and discussion is how homes exchange heat with the ground, and rightfully so - Ground heat loss is decidedly more complex than heat loss to the ambient air. I've put together a two part article called “Heat Loss to the Ground” that will explain the complexities of ground heat loss vs air (Part 1) and teach you how to calculate heat loss (Part 2.) If you'd like a change from hearing the voice in your head read this article, you can hear me live online through my live lecture on Understanding and Calculating Building Heat Loss to the Ground on September 4, 2014 at 1pm EST.
Part 1: Basic heat loss

Heat loss to the air is determined by doing a sum of conduction calculations and air change calculations. The conduction equation is U x A x ∆T – conductance times area times temperature difference. This can be written with resistance R instead – A x ∆T /R. The heat loss of air exchange is m x c x ∆T – mass flow rate times specific heat of air times temperature difference (this is all covered in Week 2 of the online course). The temperature difference can be at a moment in time, as it is when we calculate design heat loss, or it can be aggregated over a period of time, as is done when we tally heating degree days (HDD) to calculate annual heating load in an energy model. These calculations are pretty straightforward.
Characteristics of soil Below grade energy transfers are more complicated, because surfaces are surrounded by soil rather than air. The mechanism is primarily conduction. The conductivity of soil varies with soil type and moisture content, but on average it is 40-50 times more conductive than air. However, there’s another aspect to ground heat loss, which is the heat capacity of soil. Heat capacity is the ability of a substance to store heat. Volumetric heat capacity is measured in BTU/ft3-˚F. Soil has more than 1,000 times the volumetric heat capacity of air, which means it acts as a giant thermal mass around the below grade portion of the building. The soil may have much less thermal resistance than air, but its significant capacity to store heat means that it changes temperature slowly – much more slowly than air. That effect is compounded in cold climates because the water in the soil freezes to some depth annually, and as water changes to ice and back a lot of latent energy is stored and released. If we consider the thermal resistance of soil, the R value per foot ranges from below 1.0 to over 2. In the 2D heat transfer software THERM I use an R value of 1.56 (ft-hr-˚F)/BTU, meaning that one foot of soil has an R value of 1.56, or one inch of soil has an R value of 0.13.
Variation of soil temperature with depth and time The surface of the ground exchanges heat by radiation, convection, and evaporation, and therefore seasonally heat is either absorbed or released by the earth. Due to the thermal resistance of the soil and its heat capacity, the temperature at the surface varies the most, and with increasing depth the annual variation decreases. The graphic below shows that at 30 feet below grade the ground temperature is constant – so if you want to build your house where the heat load is constant, bury it :-)

Variation of soil temperature with depth The effects of soil conductivity and heat capacity also combine to create a time delay between surface temperature and temperatures deeper in the ground. Maximum and minimum soil surface temperatures are typically seen in early August and early February, respectively. At 5 ft below grade, the maximum and minimum temperatures are delayed by about five weeks, and at 12 ft below grade, the maximum and minimum temperatures are delayed by about nine weeks. Therefore, peak heat loss to the ground from a house occurs later in the winter than when the coldest outdoor temperatures usually occur.
Modeling heat loss to the ground When I want to model heat loss to the ground I use the free (from LBNL) 2D heat transfer software called THERM. Here’s a model of a basement with interior insulation of R-24 and sub-slab insulation of R18.5. The model is half of the house in width, because there is symmetry around the centerline. I’ve modeled 20 feet of soil beneath the slab. The basement interior temperature is 68˚F, the soil temperature at the bottom of the soil mass is 50˚F, and the air temperature is 0˚F. There is no heat flow laterally at the soil edges or at the top of the foundation wall, where the framing would begin. Note that this is a steady-state model, which doesn’t account for heat capacity – it assumes all the temperatures have been held constant long enough for the internal temperatures to come to equilibrium. This isn’t what happens in practice, but it’s useful enough to get a heat loss factor for the assembly. 
THERM model of basement
In the heating season the heat flow from the basement is to the outdoor air. This image shows the direction of heat flow illustrated with arrows. 
This version of the results shows the relative rate of heat loss across the model. Note that the highest heat loss is at grade at the foundation wall 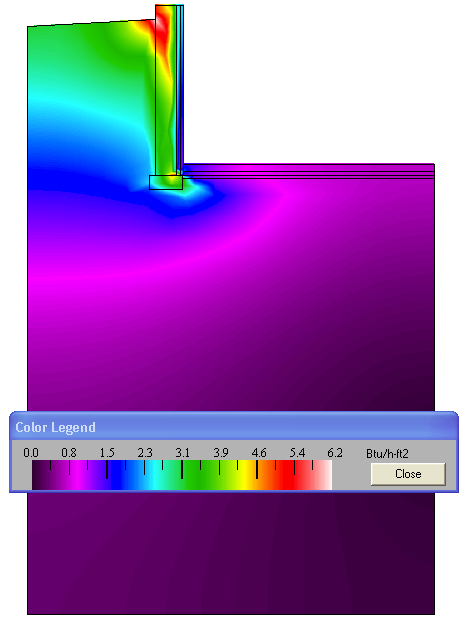
The next two images show the same thing, temperature variation across the model. The first illustrates this in color, and the second shows lines of constant temperature.


Heat flow is perpendicular to the lines of constant temperature (see the image with the arrows showing direction of heat flow.) Recall that the temperatures shown here are based on the 0˚F air temperature, and the model assumes a steady state – it’s as if it is 0˚F outside for a long time, so these are the equilibrium temperatures that would occur if all temperatures remained constant. In practice, this doesn’t happen, even in Duluth (OK, maybe it stays at 0˚F or lower in Duluth for months), so the depth that the ground is shown as freezing in the model is deeper than it would be in a place where the air gets to 0˚F or below on occasion but the average winter temperature is higher. Here the frost almost reaches the footing, which is a bad thing! What we can see is that heat flow from a heated building in a heating climate is always to the ground during the heating season – it’s always warmer in the building than the ground. Also, assuming that all the soil surrounding the foundation is at deep ground temperature, say 50˚F, is incorrect – some of the soil against the foundation in late winter could be well below the deep ground temperature. Finally, because the soil temperature changes slowly, heat flow to the ground has less short term variation than heat flow to the outdoor air.
Check back soon for Part 2 of Heat Loss To The Ground. Or do the live online lecture on September 4th, 2014 at 1pm. Or do both, because hey, why not? images from BuildItSolar.com

Old building geek.
Our Mission
NESEA advances sustainability practices in the built environment by cultivating a cross-disciplinary community where practitioners are encouraged to share, collaborate and learn.
Recent Posts


Add comment